A Guide to Real Estate Market Analysis for Agents

A real estate market analysis tells the story behind a property's price. It’s a powerful blend of hard data and expert insight that proves what a home is truly worth. This is the critical difference between guessing a price and knowing it with unshakeable confidence—a skill that turns good agents into indispensable advisors.
What Real Estate Market Analysis Actually Means

Think of it as a comprehensive financial health checkup for a property and its local market. It’s not about pulling a number out of thin air. Instead, it’s a deep dive that looks at everything from recent comparable sales and current market trends to local economic factors that influence value.
This process is the bedrock of any smart real estate strategy. A well-executed analysis doesn't just give you a number; it builds a compelling narrative backed by solid evidence. This is what lets you advise clients from a position of real strength, whether you're setting a competitive listing price or crafting a winning offer.
More Than Just a Task, It's a Core Skill
Mastering market analysis is what separates the top-tier agents from everyone else. It builds a foundation of trust that’s absolutely essential for creating long-term client relationships. When you can clearly explain why a property is valued at a certain price, you replace a client's anxiety with clarity and confidence.
This skill is more important than ever in a global real estate market projected to grow from USD 4.34 trillion in 2025 to USD 7.03 trillion by 2034. This massive expansion is driven by powerful forces like urbanization and a growing investor appetite for tangible assets. To put it in perspective, the Asia Pacific region alone is expected to swell from USD 1.75 trillion in 2025 to USD 2.92 trillion by 2034, which shows the sheer scale of the opportunity at hand.
A solid analysis is the foundation for setting the right price, building unshakable client trust, and navigating negotiations from a position of strength.
When you get the analysis right, you gain several key advantages:
- Informed Pricing: You can set a listing price that is both competitive enough to attract serious buyers and realistic enough to meet your seller's goals.
- Confident Negotiations: Armed with concrete data, you can justify your price and negotiate with authority.
- Stronger Client Relationships: Demonstrating this level of expertise proves your value and builds the kind of loyalty that lasts a career.
By truly understanding the story behind the numbers, you stop being just another agent and become a trusted market authority. This guide will show you exactly how to build this essential skill. For a closer look at the calculations involved, check out our guide on real estate property valuation methods.
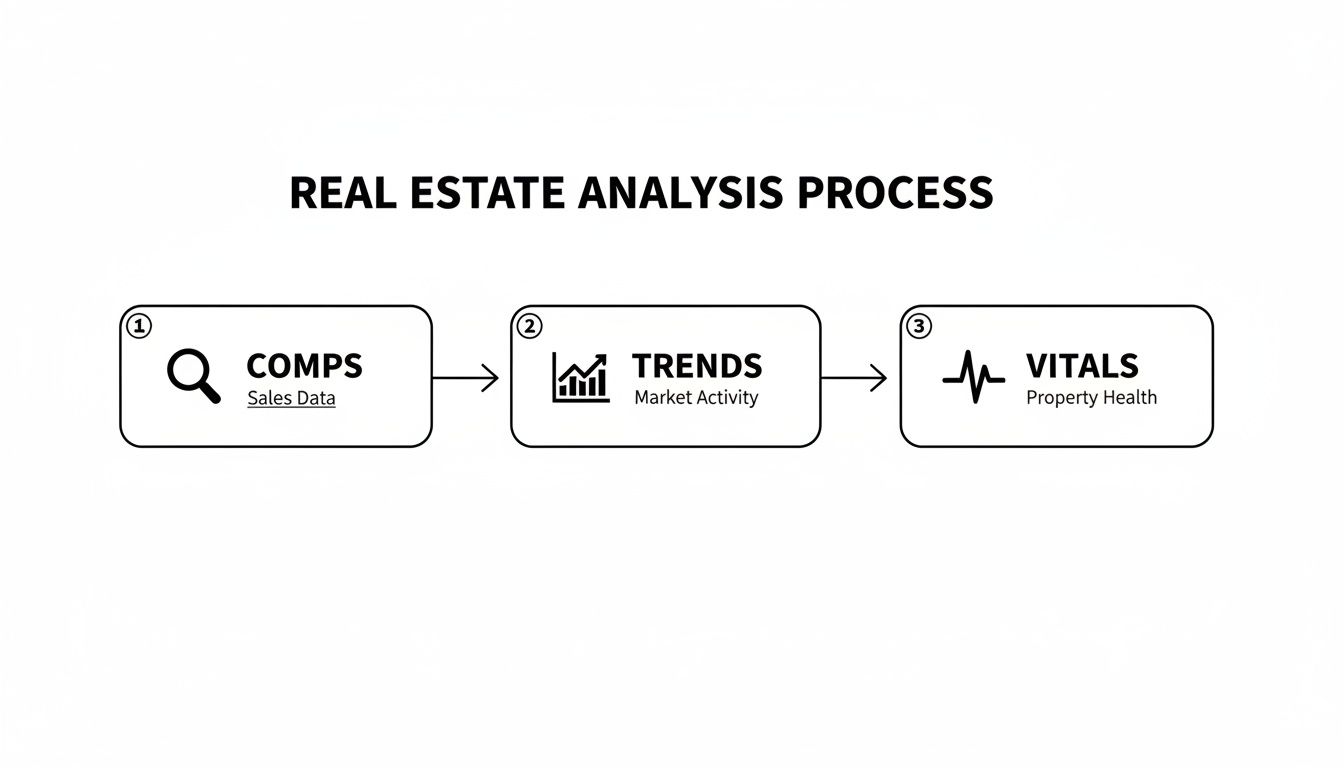
The Four Pillars of a Killer Market Analysis
A truly powerful real-estate market analysis tells a complete story, and that story rests on four essential pillars. Think of them like the legs of a table—if one is weak or missing, your entire valuation gets wobbly. The real magic happens when you see how they all connect, which is what separates a basic report from genuine, expert insight.
Each pillar gives you a different angle on the property. When you bring them all together, you get a solid, defensible picture of what that home is actually worth today. Let's break down what they are and how they fit together.
1. Comparable Properties: The Ground-Level Evidence
This is where you start, because it's the most direct evidence you have. Comparable properties, or "comps," are homes that have recently sold and are as similar as possible to your subject property—think location, size, condition, and key features. They give you a real-world baseline for what buyers have been willing to pay in that specific area, right now.
Think of comps as the neighborhood's recent report card. They show you exactly how the market has valued similar assets in the very recent past, usually within the last 90 to 180 days. This pillar answers the most basic question: "What have similar homes right around the corner actually sold for?"
2. Local Market Trends: The Current Weather Report
While comps are about looking back, local market trends tell you what’s happening at this very moment. This pillar is all about the push and pull of supply and demand in the immediate area. It's the "weather" your property will be listed in.
Key things to look at here include:
- Days on Market (DOM): How fast are homes selling? A low DOM signals a hot market where buyers are moving quickly.
- Inventory Levels: Is there a surplus of homes for sale, or a shortage? Low inventory almost always means higher prices.
- List-to-Sale Price Ratio: Are homes selling for over, under, or right at the asking price? A ratio above 100% screams a competitive seller's market.
These trends give comps crucial context. A great set of comps from six months ago doesn't mean much if inventory has suddenly flooded the market, pushing prices down.
3. Neighborhood Vitals: The Vibe of the Place
We all know location is everything in real estate, and this pillar gets into the why. It’s an honest look at the quality-of-life factors that make a neighborhood a place people want to live. These are the details that give a location its unique character and directly impact its long-term value.
This means digging into school district ratings, crime statistics, how close you are to parks and shops, and even walkability scores. A huge part of this is understanding who your buyer is, which often means looking at demographic segmentation to see what different groups of people are looking for. An identical house can command a huge premium just by being a few blocks over in a better school district.
A great real estate market analysis connects the dots. It shows how a new tech campus (Economic Influence) is shrinking the Days on Market (Market Trend), which boosts demand for homes near great schools (Neighborhood Vitals), and ultimately lifts the value of your chosen Comps.
4. Economic Influences: The 30,000-Foot View
Finally, you have to zoom out and look at the bigger picture. These are the major economic forces that affect the entire market, from local job growth to what's happening with national mortgage rates.
If a big company announces it's bringing 1,000 new jobs to town, you can bet housing demand is about to spike. On the flip side, rising interest rates can put a chill on buyer activity everywhere. This pillar makes sure your analysis isn't stuck in a bubble and connects your property to the larger economic story unfolding around it.
A thorough analysis requires tracking several data points. Here's a quick look at some of the most important metrics you'll be working with.
Key Metrics in Real Estate Market Analysis
| Metric | What It Tells You | Primary Data Source |
|---|---|---|
| Median Sales Price | The midpoint price of all homes sold in an area. Great for tracking overall value trends. | MLS, Local Realtor Associations |
| Days on Market (DOM) | The average time from listing to contract. A key indicator of buyer demand. | MLS Data |
| Months of Supply | How long it would take to sell all current listings at the current sales pace. | MLS, Public Records |
| List-to-Sale Ratio | The final sale price as a percentage of the last list price. Shows market competitiveness. | MLS Data |
| Price Per Square Foot | A common metric for comparing value, especially between dissimilar properties. | MLS, Public Records |
| Unemployment Rate | Local job market health, which directly impacts housing demand and affordability. | Bureau of Labor Statistics (BLS) |
| Mortgage Rates | The cost of borrowing money. Higher rates reduce buyer purchasing power. | Freddie Mac, Bankrate |
Understanding these numbers is the first step, but the real skill lies in weaving them together with the four pillars to tell a compelling and accurate story about a property's value.
How to Conduct a Market Analysis Step by Step
A real estate market analysis is where raw data and professional judgment collide. It’s a hands-on process, a craft that turns a spreadsheet full of numbers into a pricing strategy you can stand behind. When you follow a clear, repeatable framework, you take the guesswork out of the equation and build a valuation that gives both you and your clients real confidence.
Think of it as a four-stage journey, starting with the nitty-gritty details of your property and ending with a polished, synthesized price range.
Step 1: Profile the Subject Property
Before you can even think about finding comparable homes, you need to know your own property inside and out. A detailed profile is your anchor for the entire analysis—and it’s more than just counting bedrooms and baths.
Get granular and document every key feature:
- Core Specs: Nail down the exact square footage, lot size, the year it was built, and of course, the number of bedrooms and bathrooms.
- Unique Features: What makes it stand out? Is there a freshly renovated kitchen, a finished basement perfect for a home theater, a sparkling swimming pool, or a killer view? These are your value drivers.
- Condition: Be brutally honest here. Is the property truly move-in ready, or does it need some cosmetic love? Maybe it’s a full-gut renovation project.
Creating this detailed blueprint ensures you’re looking for genuinely similar properties, not just homes that happen to look the same on paper.
Step 2: Hunt for the Strongest Comps
With your subject profile locked in, it’s time to go on the hunt for "comps"—your comparable properties. The mission is simple: find recently sold homes that are as close a match to your subject property as possible. It's like being a detective, piecing together the most relevant clues.
Your search should be laser-focused on three core criteria:
- Recency: The fresher the data, the better. Always prioritize sales from the last 90 days. If you’re in a slower market, you might have to stretch that to six months, but recent sales reflect current buyer sentiment.
- Proximity: Start your search within a half-mile radius and only expand if you come up empty. A comp down the street is always more relevant than one across town.
- Similarity: This is where your detailed profile pays off. Match those core specs as closely as you can. A good rule of thumb is to stay within a 10-15% variance on square footage.
A great comp isn't just a similar house; it's a reflection of what a ready, willing, and able buyer recently paid for a property like yours in the current market climate.
This whole process is about finding the right foundation (your comps) and then layering on context from market trends and neighborhood specifics.
As you can see, strong comps are the starting point, but the analysis is refined by understanding the bigger picture.
Step 3: Apply Smart Adjustments
Let’s face it, no two properties are ever truly identical. That's where adjustments come in. This is the "art" of the analysis, and it requires logical reasoning backed by real-world costs.
It’s a simple give-and-take. If a comp has a superior feature—say, a brand-new roof your property lacks—you need to subtract the value of that feature from the comp's sale price. Conversely, if the comp is inferior because it has one less bathroom, you add the value of a bathroom to its price.
Don’t just pull numbers out of thin air. Use realistic estimates for these features. For example, if a new deck adds about $15,000 in value in your market, adjust accordingly.
Step 4: Synthesize Your Findings
The last step is to bring it all together. You've done the legwork, now it's time to connect the dots. Resist the urge to just average the adjusted prices of your comps—that’s a rookie mistake.
Instead, look at the full range of values. Give more weight to the comps that are the closest match to your subject property. Are one or two comps practically a mirror image? Their adjusted prices are your strongest indicators.
This method will give you a defensible price range, not just one magic number. Presenting a valuation like $525,000 to $540,000 shows your client you’ve done your homework and provides a strategic place to start the pricing conversation.
For agents looking to organize this whole process, a good worksheet is invaluable. You can grab a helpful comparative market analysis template to keep all your findings in one clean, professional place.
Reading the Signals of a Changing Market
A standard real estate market analysis tells you what a property is worth today. A truly exceptional one gives you a glimpse into where its value is headed tomorrow. Top agents don't just react to the market; they read the signals and anticipate the next move, giving their clients a serious strategic advantage.
It's all about looking beyond the handful of comps and zeroing in on the broader dynamics shaping every deal. Think of it like a weather forecast for real estate. Knowing it might rain doesn’t just tell you to grab an umbrella—it changes your travel plans, your timing, and your whole strategy for the day.
The same is true for the market. By reading the key indicators, you can advise clients with foresight, helping them navigate shifts with confidence instead of being caught off guard.
Identifying the Market Type
First things first, you have to diagnose the current market climate. Are we in a seller's, buyer's, or balanced market? Each one has its own personality and demands a completely different approach to pricing, offers, and negotiation. The vital signs are clear if you know where to look.
Three core metrics will give you the answer:
- Inventory Levels: This is your classic supply and demand. Low inventory (fewer homes for sale) creates fierce competition and puts sellers in the driver's seat. High inventory gives buyers more choices and, with it, more power.
- Absorption Rate: This number tells you how fast the available homes are getting snapped up. A high absorption rate signals strong demand and a fast-moving market—a dead giveaway of seller strength.
- List-to-Sale Price Ratio: When homes are consistently selling for over 100% of their asking price, you're in a hot seller's market. If that ratio starts dipping below 98%, you know the negotiating power is sliding over to the buyer's side.
A seller’s market feels like a frantic auction, while a buyer’s market is more like a patient negotiation. Recognizing the difference allows you to set client expectations and craft a winning game plan from the start.
Connecting Macro Trends to Local Values
Beyond these immediate signals, the real magic happens when you connect the dots between big-picture economic trends and local property values. A change in national mortgage rates doesn't happen in a vacuum; it directly impacts how much a buyer can afford for a home in your specific neighborhood.
Likewise, news of a major company relocating to your city is more than just a headline—it's a direct indicator of future housing demand. By weaving these macro trends into your analysis, you’re not just telling clients what their home is worth now; you're giving them forward-looking advice that positions them for success.
This kind of proactive thinking is becoming essential. As transaction volumes bounce back—up 19% year-over-year to $739 billion across major markets—agents armed with dynamic insights will leave their competitors in the dust. This is where modern tools come in, helping turn macro stats into micro wins, like pricing a home just right to meet emerging demand. You can discover more insights about this growth trajectory and what it means for the market.
Using AI to Accelerate Your Analysis
What if you could pull together a comprehensive market analysis in the time it takes to grab a cup of coffee? While the old-school methods still have their place, they are incredibly time-consuming. Today, modern AI platforms give agents a serious advantage, helping you speed up this foundational work so you can spend less time on manual research and more time on client strategy.
AI-powered systems are built to crunch thousands of data points in seconds. They can scan live MLS listings, dissect historical sales data, and spot subtle market shifts that might take a human agent hours to piece together. This isn't about replacing your hard-earned expertise; it's about amplifying it with a level of speed and precision that was unimaginable just a few years ago.
From Hours to Seconds
The most obvious win when you bring AI into your workflow is the sheer amount of time you get back. Instead of spending an afternoon digging through property records, manually adjusting comps, and building reports from scratch, you can generate a detailed analysis almost instantly. This kind of efficiency means you can help more clients without ever cutting corners on the quality of your insights.
A perfect example is the Comparative Market Analysis (CMA). Platforms like Saleswise are designed to produce a polished, client-ready CMA report in about 30 seconds. That’s time you can now spend advising clients, not fighting with spreadsheets.

This kind of dashboard shows how AI can take complex market data and boil it down into clear, visual charts that you can understand at a glance. What used to be a mess of scattered data points becomes a clean, actionable story.
More Than Just Speed
While getting your analysis done faster is a huge plus, the best tools go further by improving your entire workflow, from initial analysis all the way to marketing the property. A truly connected platform links your real estate market analysis directly to the next logical steps in your sales process.
For example, right after generating that CMA, the same system can draft a compelling, AI-written listing description that uses the data to highlight the property's best selling points. It creates a smooth, logical, and incredibly efficient process from start to finish.
AI-driven analysis gives you a powerful competitive edge. It’s a combination of speed, data-backed accuracy, and the ability to scale your work, empowering you to deliver expert-level insights for every client, every time.
For any modern agent, this technology offers a few key advantages:
- Unmatched Speed: Create full reports and CMAs in under a minute, freeing you up for more face-to-face client time.
- Laser-Focused Accuracy: AI algorithms sift through huge datasets to pinpoint the most relevant comps and trends, minimizing the chance of human error.
- Scalable Operations: Take on a higher volume of clients without burning out by automating the most labor-intensive parts of your analysis.
To get a better sense of how artificial intelligence is changing the game, it’s worth exploring the different AI tools for real estate agents that are out there. These platforms are quickly becoming essential for staying competitive. You can learn more about the specific real estate market analysis tools that can give your business a decisive edge.
Common Questions About Market Analysis
Even with a solid game plan, a real estate market analysis can throw you a few curveballs. Every agent runs into the same tough spots, from digging up comps in a quiet market to figuring out how to value a one-of-a-kind property. Let's walk through some of the most common questions to build your confidence and make sure your analysis is rock-solid.
Think of these as the final stress tests for your valuation. Getting these right ensures your analysis won't just impress your client but will also hold up under the scrutiny of other agents or even a bank appraiser.
How Far Back Should I Look for Comparable Sales?
The gold standard for comps is 90 days. Why? Because sales within that three-month window give you the clearest, most accurate snapshot of what's happening in the market right now. It reflects current buyer demand, financing conditions, and overall sentiment. This timeframe is tight enough to be relevant without getting polluted by old, stale data.
Of course, real estate isn't always that neat. In slower markets or for truly unique homes, you'll likely have to stretch that timeline. Going back six months is generally acceptable in these situations, but you absolutely have to make adjustments for time. Any comp older than six months is usually too dated to be a reliable benchmark for today's value.
What if There Are No Good Comps Nearby?
This is a classic problem, especially for rural properties or that quirky architectural gem with no twins. When you hit a wall finding comps right next door, you need to expand your search, but do it strategically.
First, widen the map to include similar, nearby neighborhoods. Look for areas that share the same school district, lifestyle appeal, or general vibe. Next, you can loosen your property criteria just a bit—maybe look at homes with slightly different square footage or one less bathroom. The catch is that you have to be prepared to make larger, well-documented adjustments. The key is to justify every single choice and walk your client through why you believe a specific property is a valid comparison.
Adjusting for a home's condition can feel more like an art than a science. The best way to handle it is to think in terms of cost. If a comp has a brand-new $30,000 kitchen but your client's home has a dated one, you need to subtract a portion of that upgrade value from the comp’s sale price to make it a fair comparison.
Can I Just Use an Automated Valuation Model?
Absolutely not. Look, Automated Valuation Models (AVMs) are great for a quick ballpark figure, but they should never, ever be the final word. An AVM can't see that a "comparable" property was a foreclosure, that your subject property has a stunning city view, or that the neighborhood is on the brink of a major revitalization.
A true real estate market analysis is where your expertise shines. You combine the raw data from an AVM with your irreplaceable human judgment. For instance, a global housing crisis is creating a shortage of 6.5 million units in major economies and pushing over 80% of households toward renting. An algorithm can't fully grasp the on-the-ground impact of these massive shifts, but a great agent can. You can get a better handle on these global real estate shifts to see the bigger picture.
Ready to create lightning-fast, accurate CMAs and accelerate your entire workflow? Saleswise generates client-ready reports, virtual staging, and marketing content in seconds, giving you more time to focus on what matters most—your clients. Start your $1 seven-day trial at https://www.saleswise.ai and see the difference.