What is absorption rate in real estate: How to read market health at a glance
The absorption rate is one of the most powerful—and most overlooked—metrics in real estate. Simply put, it tells you how fast homes are actually selling in a specific market.
Think of it like this: if you have a shelf full of cookies, the absorption rate is how long it takes for customers to buy them all. If they're gone in an hour, you've got a hot product. If they're still sitting there a week later, demand is low. Real estate works the same way; we're just talking about houses instead of cookies.
This single number cuts through the noise and gives you a real-time pulse on local supply and demand. It measures the rate at which listed homes are “absorbed” (sold) over a given time, usually a month. Calculating it turns a vague "how's the market?" question into a data-backed conversation.
Armed with the absorption rate, you can definitively answer your clients' biggest questions: Is it a good time to buy? Is it a smart time to sell? This isn't just another statistic; it's a strategic tool.
What Is a Good Absorption Rate?
The absorption rate is your market's thermometer. A high reading means a hot seller's market, while a low reading points to a cool buyer's market. A number in the middle suggests things are balanced.
Generally, an absorption rate of 20% or higher screams "seller's market." Demand is chewing through inventory faster than new homes are being listed. On the flip side, a rate dipping below 15% indicates a buyer's market, where a surplus of homes gives buyers the upper hand and more room to negotiate.
To give you a quick reference, here's how the numbers typically break down. This is a great little cheat sheet to have handy when a client asks what the market is really doing.
Market Conditions at a Glance
| Absorption Rate | Market Type | What It Means for You |
|---|---|---|
| Above 20% | Seller's Market | High demand, low inventory. Expect multiple offers, fast sales, and prices likely trending up. Great for sellers. |
| 15% - 20% | Balanced Market | Supply and demand are in equilibrium. Homes sell at a steady pace, and prices are stable. Fair conditions for both buyers and sellers. |
| Below 15% | Buyer's Market | More homes than buyers. Properties sit longer, prices may soften, and buyers have more negotiating power. Great for buyers. |
Understanding where your local market falls within these ranges is the first step to crafting a winning strategy, whether you're advising a seller on pricing or helping a buyer make a competitive offer. Learn more about navigating different market dynamics and what they mean for your clients.
How to Calculate the Absorption Rate Step by Step
Calculating the absorption rate is way easier than it sounds. You don't need some complex spreadsheet or a degree in mathematics—just two simple numbers you can pull straight from your local MLS.
The whole point of this formula is to cut through the market noise. It gives you a clear percentage that shows you exactly how fast homes are flying off the shelves. Think of it as your secret weapon for turning raw data into a convincing story for your clients.
The Basic Formula
The most common way to get the absorption rate is with a pretty straightforward formula:
Absorption Rate = (Number of Homes Sold in a Set Period ÷ Total Number of Available Homes) x 100
The key to an accurate number is consistency. You have to use data from the exact same time period and the same geographic area. For instance, you’d look at all the homes sold in the last 30 days in a specific neighborhood and divide that by the total number of active listings in that same neighborhood today.
Let’s walk through what this looks like with a real-world example.
A Practical Calculation Example
Let's say you're getting ready for a listing presentation in the Maplewood neighborhood. You hop on the MLS and pull the numbers for the last 30 days. Here’s what you find:
- Number of Homes Sold (Past 30 Days): 25
- Total Active Listings (Today): 110
Now, we just plug those numbers into our formula:
- Divide homes sold by active listings: 25 ÷ 110 = 0.227
- Multiply by 100 to get a percentage: 0.227 x 100 = 22.7%
Boom. The absorption rate for Maplewood is 22.7%. This single number tells you instantly that the market is hot and leaning heavily in the seller's favor. That’s a powerful piece of evidence to bring to your pricing conversations.
This infographic gives you a great visual for how different absorption rates translate to market speed.
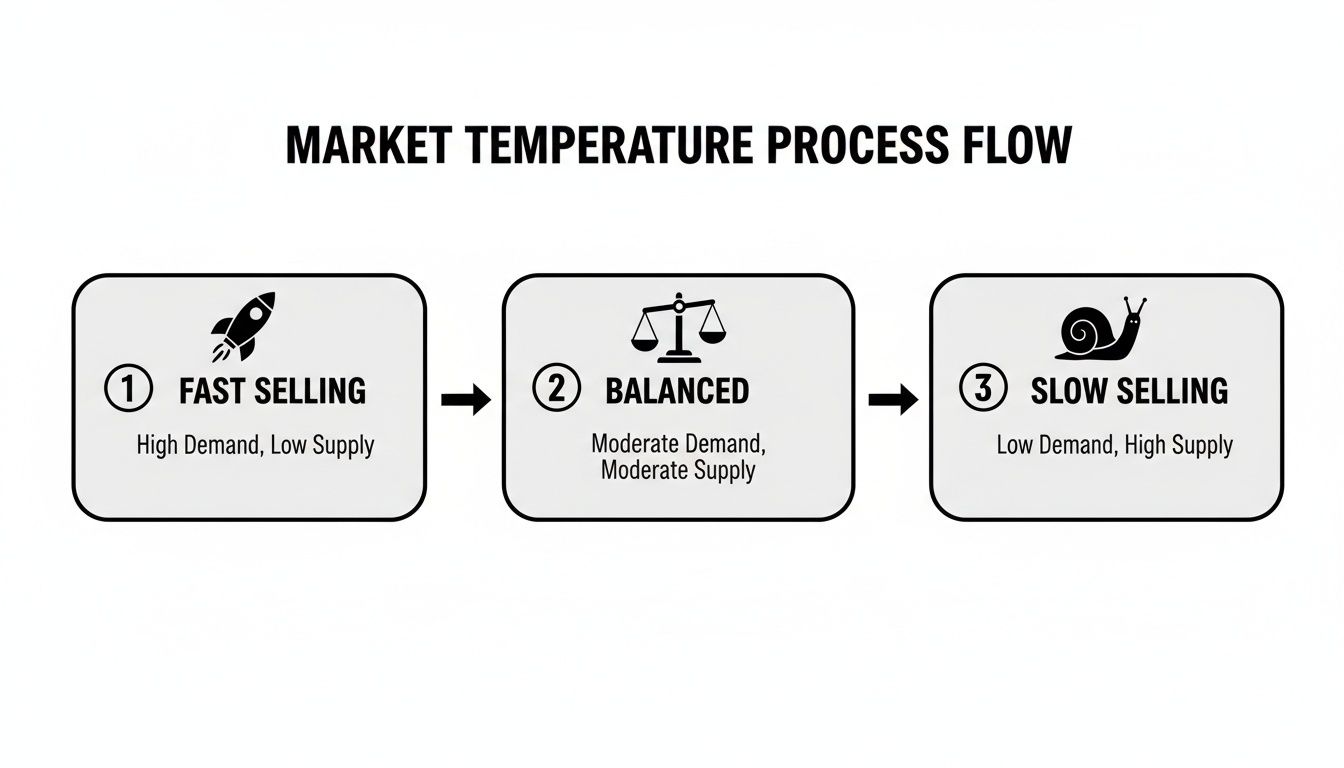
As you can see, a high rate means a fast-moving market, while a lower rate points to sluggish sales and gives buyers more room to negotiate.
Turning the Rate into Months of Supply
While the percentage is great for us agents, "months of supply" is often a concept that clicks much faster for clients. It directly answers their question: "If no new homes came on the market, how long would it take for everything to sell?"
To find the months of supply, just divide 1 by the absorption rate (as a decimal).
Let’s go back to our Maplewood example, where the absorption rate was 0.227:
- Months of Supply = 1 ÷ 0.227 = 4.4 months
This is an incredibly powerful metric to share. Telling a seller, "Right now, there's only 4.4 months of inventory available in your neighborhood," makes the market conditions feel real and urgent. It’s a core component of any solid, data-backed comparative market analysis. If you want a deeper dive, check out our guide on how to do a comparative market analysis.
Translating Data into Market Insights

Running the numbers on absorption rate is one thing, but knowing what to do with that information is where the real magic happens. This single metric tells you a story about your local market's personality—is it a frantic sprint, a casual stroll, or something in between?
When you can interpret the absorption rate, you're not just looking at a number; you're seeing the balance of power between buyers and sellers. It's the key to setting realistic expectations for your clients and building a strategy that actually works in the current climate.
Decoding Market Conditions
Think of the absorption rate as the speedometer of your local housing market. You wouldn't drive the same way at 70 mph as you would at 20 mph, right? It's the same in real estate. A high absorption rate means things are moving fast, while a low one signals a much slower pace.
Ultimately, this is all about good metrics and reporting that drive growth—a concept that applies to any business, not just real estate. You’re turning raw data into a clear roadmap.
So, let's break down the three main market types you'll see:
Seller's Market (Above 20%): When the rate pushes past 20%, you’re in a classic seller's market. Demand is red-hot, and it's far outstripping the available supply of homes. Listings get snatched up almost as soon as they hit the market, often sparking multiple offers and bidding wars. Here, sellers are firmly in the driver's seat.
Buyer's Market (Below 15%): A rate that drops below 15% tells you it's a buyer's market. There are simply more homes for sale than there are people ready to buy them. This means properties tend to sit on the market longer, giving buyers more choices, more time to think, and a whole lot more leverage to negotiate on price.
Balanced Market (15% to 20%): This is the sweet spot. When the rate hovers between 15% and 20%, the market has found its equilibrium. The number of homes for sale is pretty much in line with the number of buyers, which leads to predictable sale times and steady, healthy price growth. Neither side has a major advantage, making for smoother transactions all around.
By looking at the absorption rate, you’re not just seeing numbers; you’re seeing human behavior. You’re measuring the collective urgency of buyers against the available inventory, which is the core of any market analysis.
A Real-World Example of High Absorption
The post-pandemic housing boom gave us a masterclass in just how much the absorption rate can reveal. Take the Virginia Beach market at the end of September 2023. There were 623 homes for sale, but a whopping 463 homes were sold in that same month.
That works out to an absorption rate of nearly 75%—an unbelievably high number that perfectly captured the intense supply-and-demand crunch gripping so many markets at the time.
When demand is that fierce, it changes everything about how you have to operate as an agent. It's not enough to just see the numbers; you have to understand the story they tell. That's why having a solid process for how to do market analysis is so critical. A clear interpretation of the absorption rate lets you give clients a data-backed narrative of the market and a clear plan to win.
Using Absorption Rates to Win More Listings

Think of the absorption rate as your secret weapon in a competitive market. It’s what separates the agents who guess from the ones who know. For top producers, this isn't just another industry metric—it's a critical tool they use in listing presentations, client meetings, and marketing plans to get the best possible results.
When you can confidently explain what the absorption rate means for a seller's specific property, you instantly elevate yourself from salesperson to market expert. It’s the difference between saying, "I think we should list your home at this price," and proving, "The data shows this is the exact price point that will generate the most interest right now." That small shift from opinion to hard evidence is how you build unshakable client trust and win listings.
Build a Data-Backed Pricing Strategy
Let's be honest: the pricing conversation is the make-or-break moment of any listing presentation. The absorption rate gives you the objective proof you need to back up your strategy and get the seller on your side from the very beginning. Instead of just showing them a few comps, you can paint a clear picture of how fast the entire market is moving.
And the best part? This approach works no matter what the market is doing.
In a Seller's Market (High Absorption Rate): A high rate is your green light for a more aggressive strategy. You can walk into that listing appointment and say, "With an absorption rate of 25%, homes in this neighborhood are flying off the shelves. This tells me we can price confidently at the top of the market, because buyers are actively competing for the few homes available."
In a Buyer's Market (Low Absorption Rate): A low rate is your tool for having a tough but crucial conversation. You can explain, "The current absorption rate is only 12%, which means buyers have a lot of options and sellers are facing stiff competition. To make your home the one that gets the offer, we need to price it strategically from day one."
This data-driven approach takes the emotion out of the pricing discussion. Suddenly, you're not just a salesperson pushing a number; you're a strategic advisor guiding them through the market. Digging into the nuances, like whether the market shows strong net absorption (a true sign of demand), can further refine your strategy. For a deeper dive, check out this guide on how to interpret absorption rate data on Wall Street Prep.
Key Takeaway: The absorption rate transforms your pricing recommendation from a suggestion into a conclusion backed by hard data. It’s the most persuasive tool you have for aligning with your sellers on price.
Calibrate Your Marketing and Staging Efforts
The absorption rate does more than just help you set a price—it dictates the urgency, pace, and intensity of your marketing plan. A one-size-fits-all approach just doesn't cut it. Instead, you can use the market's velocity to decide exactly where to invest your time, energy, and money for the biggest impact.
High Absorption Rate (Fast Market):
- Action: Go all-in with an aggressive, front-loaded marketing blitz.
- Tactics: Your goal is to create a "launch" event. Think professional photos, one massive open house weekend, and a clear offer deadline to crank up the buyer urgency and spark a bidding war.
Low Absorption Rate (Slow Market):
- Action: Settle in for a patient, consistent, and high-impact campaign.
- Tactics: This is where you can’t afford to cut corners. Professional staging, virtual tours, and premium marketing materials become absolutely essential. The goal here is to make the property the undeniable best-in-class, ensuring it captures the attention of the smaller buyer pool over a longer period.
What the Absorption Rate Doesn't Tell You
The absorption rate is a fantastic tool for taking the market's temperature, but it's not a crystal ball. Every seasoned agent knows that the real expertise isn't just in knowing the numbers, but in understanding their limitations. Relying on this single metric without digging into the bigger picture can lead to some seriously flawed advice.
Think of it as a snapshot, not the full movie. It captures one specific moment in time and can be thrown off by temporary market shocks. A sudden jump in interest rates, for example, might make the absorption rate dip for a month, even if the underlying demand from motivated buyers hasn't really changed.
It's a 30,000-Foot View
One of the biggest rookie mistakes is applying a city-wide absorption rate to an individual property. This metric becomes truly powerful only when you get specific. A city’s overall rate might look balanced at 18%, but that single number could be hiding a wildly different reality on the ground.
Maybe the market for luxury condos is a buyer's paradise at 9%, while entry-level townhomes are sparking bidding wars at a blistering 35%. To give advice that actually helps your clients, you have to slice the data into more relevant pieces:
- By Neighborhood: Is the historic district’s market behaving differently than the new suburban development across town?
- By Price Point: How does the market for homes under $500k stack up against the million-dollar-plus segment?
- By Property Type: Are single-family homes flying off the market while condos are sitting?
Drilling down to this level is what separates a true local market authority from someone just rattling off generic stats. It allows you to tailor your strategy to your client’s specific home and situation.
It Can't See Outside Events Coming
The standard absorption rate formula is simple math, but real estate is anything but simple. The calculation doesn't factor in outside events that can temporarily throw the market for a loop. Imagine a big new development suddenly releases 50 homes onto the market—that flood of new inventory can make a perfectly healthy market look sluggish overnight.
The absorption rate tells you what is happening with supply and demand, but it doesn't always tell you why. Your job as an expert is to investigate the "why" behind the numbers.
Seasonality is another huge factor the basic formula ignores. We all know that sales tend to cool off in December and heat up in the spring. Comparing May’s absorption rate directly to January’s will give you a skewed reading on market momentum. A much smarter approach is to compare this month's data to the same month from previous years. That's how you spot a real trend, and it's the kind of nuanced analysis that builds trust with clients.
Ditch the Manual Math and Wow Your Clients
Let's be honest: manually crunching market numbers is a grind. Every minute you spend digging through MLS data, running calculations in a spreadsheet, is a minute you're not out there connecting with clients and actually closing deals. This is where the right tools can give you back your most valuable resource—your time.
What if you could turn the whole process of calculating the absorption rate and building a full market report into something that takes less than a minute? That’s not a hypothetical; it's what happens when you have a smart assistant designed for real estate pros.
Go from Tedious Tasks to Instant Insights
We built Saleswise to take the guesswork and tedious math out of your market analysis. Our platform plugs directly into live MLS data to automatically figure out the absorption rate, months of supply, and other key stats for any neighborhood or property you're looking at.
This means you can pull together a polished, client-ready Comparative Market Analysis (CMA) in seconds. Instead of spending an hour (or more) hunting down comps and double-checking your formulas, you get an accurate, data-driven report that instantly establishes you as the local market expert.
Here’s a quick look at how Saleswise lays out the market data in a clean, professional way.
The dashboard gives you an instant visual on the key metrics. This makes it incredibly easy to spot trends and explain what’s happening in the market to your clients with total confidence.
By automating this part of your job, you can shift your focus to strategy and client service. And it doesn't have to stop at market analysis. Think about other areas where you can create a smoother workflow, like using remote online notary services to create a seamless experience for your clients from the first handshake to the final signature.
When you have the right tools in your corner, you can deliver sharp, data-backed insights that win listings without burning through your day. To see more on this, check out our complete guide to real estate market analysis software.
Common Questions About Absorption Rate
How Often Should I Run This Calculation?
You'll want to calculate the absorption rate monthly. Any more frequently, and you'll get lost in the day-to-day noise. Any less, and you might miss a crucial shift in the market.
Think of it as taking the market's pulse. A monthly check-in gives you a reliable trendline. When you're prepping for a listing presentation, always pull the data from the most recent full month to give your clients the freshest, most accurate advice.
What's a Good Absorption Rate for My Sellers?
For sellers, a rate climbing above 20% is fantastic news. This points to a hot seller's market where homes are flying off the shelves. In this environment, you can expect strong buyer competition, and sellers have much more leverage in negotiations.
A rate between 15% and 20% still signals a healthy, balanced market. It's not a frenzy, but it's a great climate for a well-priced, well-marketed home to sell successfully.
How Do I Talk to a Seller About a Low Absorption Rate?
This is where your expertise really shines. Don't present a low absorption rate (anything under 15%) as bad news—frame it as the competitive landscape you need to navigate together.
Explain that it's a buyer's market, meaning there are more homes for sale than active buyers. This isn't a reason to panic; it's the reason they hired you. Use the data to underscore why your strategy for pricing, staging, and marketing is so essential. It’s what will make their property stand out from the crowd and capture the attention of the most serious buyers.
Stop drowning in spreadsheets and manual market research. With Saleswise, you can create a client-ready CMA, complete with precise absorption rate calculations, in about 30 seconds. See how much time you can get back in your day: Try Saleswise now.